
Religious Freedom in a Secular society
Is there a relationship between religious freedoms and secularity? We take some recognized measures of religious liberty and investigate the relationship with the NOVA Index of Secularity.
Article 18 of the UN Universal Declaration of Human Rights (1948) clearly states that ‘Everyone has the right to freedom of thought, conscience and religion; this right includes freedom to change his religion or belief, and freedom, either alone or in community with others and in public or private, to manifest his religion or belief in teaching, practice, worship and observance.’
Measuring religious freedom
There are many different ways of measuring religious freedom; for this study we have used as our primary source the 2009 Pew Forum Global Restrictions on Religious Freedom report, available from http://pewforum.org/Government/Global-Restrictions-on-Religion.aspx
Researchers measured reported incidents of ‘religious violence, intolerance, intimidation and discrimination’ in each country between mid-2006 and mid-2008, collating information from 16 primary sources. These included country constitutions; Amnesty International reports; U.S. State Department Country Reports on Human Rights Practices; U.N. Special Rapporteur on Freedom of Religion or Belief reports and the Council of the European Union annual report on human rights.
Through a coding process, two indices were complied: a Government Restrictions Index (GRI) and a Social Hostilities Index (SHI), each using a scale of 0-10.
The GRI covered issues such as whether or not all faiths received the same level of government access and privileges, did the constitution affect religious freedom, and if religious groups had to register.
The SHI included tensions and hostilities within and between religious groups, for example whether people of one faith were being hindered from operating by other organisations or religious groups, or hostility due to conversion or proslyetism.
Countries within both indices were categorised into very high, high, moderate and low levels, and this study has followed these same basic categories. Whilst globally the study found that 32% of countries had ‘high or very high’ levels of religious restriction, none of the European countries included in this study had ‘very high’ levels, and only three (Russia, Turkey and Greece) had both high levels of government restrictions and social hostility.
Measuring secularity
The Nova Index of Secularity (NIS) analyses results from the European Values Survey, and ranks 25 countries in relative order of secularity. It includes measures of belief in God, religious identity, the importance of religion, attendance at religious services and confidence in the church.
Following its launch in October 2010, further analysis of the EVS data has led to some enhancements in the figures. The number of countries included in the index has risen to 25 which means the population of the countries covered by the index is now 760 million. A sixth dimension of religiosity/secularity, the frequency of private prayer is now included. Furthermore, all the responses to a question – including ‘don’t knows’ – are now taken into account. This is a significant proportion of the responses for some countries. Finally, age restrictions have been established limiting the index to respondents between 20 and 80 years old and the index has been normalised to a scale of between 0 and 1.
Despite these methodological innovations, the relative ranking of the 25 countries remains largely unchanged, with the Czech Republic, Germany and Sweden as the most secular countries, and Greece, Poland, Romania and Turkey as the least.
Religious Freedom and Secularity
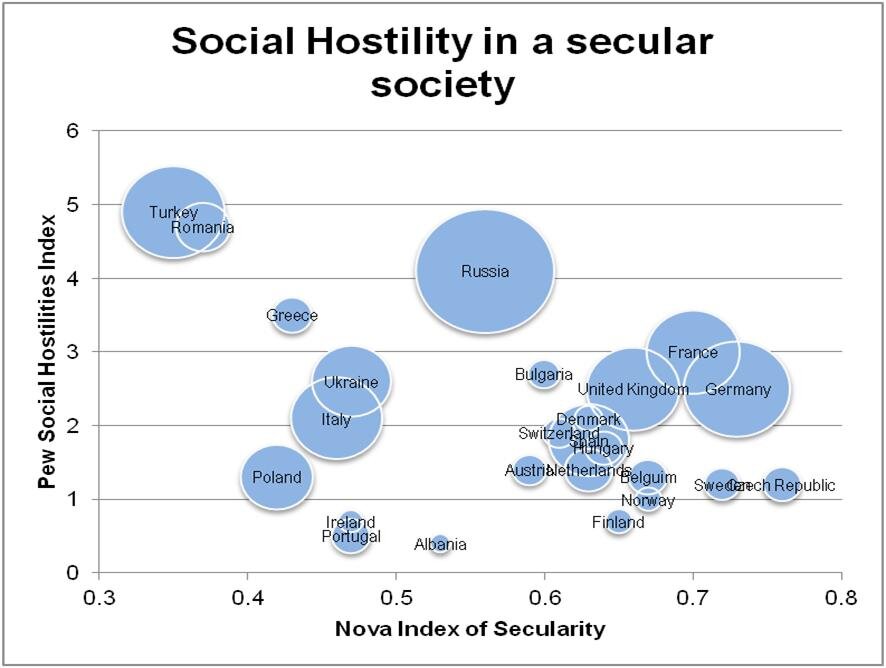
So, are secular countries less religiously restrictive and socially hostile? Broadly speaking, yes. These two dimensions, as described by their GRI and SHI values, have been plotted against the NIS values and the results can be seen in Figures 1 and 2., and the population of each country reflected in the size of the circle.
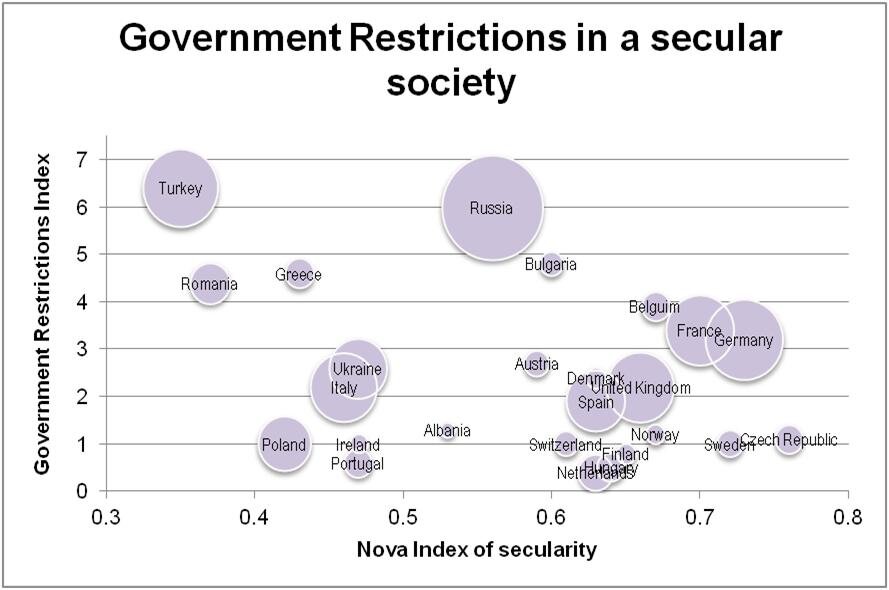
It is immediately apparent that all the countries with high levels of secularity have either low or moderate restrictions. Germany, France and Belgium have higher levels of government legislation governing freedom than the other high secular countries. The UK has moderate social hostility with much levels of government restriction, whereas Belgium has greater levels.
Moderately secular countries vary in the amount of religious freedom they experience. Surprisingly, Albania has the least restriction and hostility of this group – whilst Russia has high levels of both hostility and restriction. Most of the counties in this group have higher levels of government restriction than social hostility, however Switzerland experiences moderate social hostility alongside low levels of restriction.
The least secular countries have varying amounts of religious restrictions.
The traditionally Catholic countries of Ireland, Portugal and Poland all enjoy low levels of government restriction and social hostility, and Italy is only marginally moderate. The predominately Orthodox countries of the Ukraine, Greece and Romania and the secular Muslim state of Turkey are more restrictive.
When you plot the religious restrictions on a graph against NIS unsurprisingly there are clusters around moderate to high levels of secularity and low levels of religious restriction. Belgium, France and Germany stand out as being relatively more restrictive, but still much lower than Turkey, Romania, Russia or Greece.
In these graphs, the size of the circle gives an indication of the relative size of population, according to the latest figures from the US Department of State website www.state.gov. If you rank the counties into high, moderate or low for each category it is possible to see what percentage of the total population in these countries fall into each category.
With regard to secularity, the 25 countries in this study range between 0.37 (not very secular) to 0.76 (much more secular). Therefore no countries are completely secular or non-secular. However in order to simplify analysis, we took the range between the highest and lowest, and divided it into three. Therefore countries between 0.35 and 0.48 are considered to have low levels of secularity, those between 0.49 and 0.62 are considered to be moderately secular, and those between 0.63 and 0.76 have relatively higher levels of secularity. When compared to population, more people live in highly secular societies than the other two categories, however almost a third live in countries with relatively low levels of secularity (Figure 3).

Europe at a glance: secularity, restriction and social hostility
Almost a third of the population of Europe live in countries with high levels of government restrictions and social hostility. However, it must be remembered that the population of Russia and Turkey, together make up 28.3% of the 760 million covered by this analysis. So in fact only around 2.5% of people in this study living outside of Russia and Turkey experience high levels of government restriction (although these figures do not include Belarus…) and 4.2% of people in countries high levels of social hostility.
Almost half of the people in these 25 European countries experience relatively low government restrictions, but there is much greater social hostility, with only a quarter of the population living in a country with low levels.
There are some caveats to this study. While we look at the population as a whole, the restrictions or hostility may be directed towards a minority within a given country (e.g Muslims in France or Baptists in Russia), leaving the vast majority of the population are free to practice their faith.
Secondly, both the Pew Index and Nova Index of Secularity use data from before 2010. Since then, there have been increasing restrictions on religious minorities, with Hungary’s July 2011 law formally recognising only 14 of over 300 religious groups active in the country, or the Netherlands and Belgium banning the burkha, for example.
Jo Appleton and Jim Memory

